In last topic i tried to cover Sys schema introduction and how it is useful for a DBA in daily task :
Continuing this further :
As you know that sys schema helps DBA to get insight into what Mysql is doing with the help of its inbuilt views,stored procedure and functions.
Now to know which object is available , you can use information schema with help of below query :
select table_name, table_type from information_schema.tables where table_schema=‘sys’ union select routine_name, routine_type from information_schema.routines where routine_schema=‘sys’;
Now to check version of sys you are using;
select sys_version from sys.version;
Now , if i want to check the file I/O by hostname and latency, I can use below view and it will display data in picoseconds which is really useful for optimising large scale application.
host_summary_by_file_io;
Now going more inside , if I want to see each stage of long running DML and its status, I can use views like processlist, session. To use this concerned instruments and consumers must be enabled, as i described in my earlier sessions related to the performance schema.
For example, if I would like to see current progress on alter table operation, I can use views like host_summary_by_stages for below mentioned stages :
copying to tmp table
alter table (end)
alter table (sort)
We can also check lock latency, total rows examined, whether it is a full scan etc and then DBA can further optimise the query.
Please note , you cannot use mysqldump to take dump of sys schema rather you need to declare sys schema explicitly.
Naming convention : On doing show tables in sys schema, for every view there will be one more view prefixed with x$ which means that output is in human readable format.
Conclusion – In this topic, we have learnt how sys schema can be useful for us if we don’t want to make use of the performance schema.
As you know that MySQL 5.7 is going to be in its end of life this month (when I wrote this article) and many businesses are upgrading to 8 ( except few ones, believe me its true) . Many cloud vendors are providing extra support and time to their customer so that they can move…
This setup is on my local machine for mac with 8.0.44. M2 chip, memory 16G High level Results : total transaction executed in 10 min – 247298Transaction per minute – 24729Time taken on average for every case – 0-26ms ( you have to do this calculation , testing wont tell you this. I have done…
Thought of writing this blog came in my mind when I was struggling with high CPU and waiting of queries in my live production environment of MySQL DB . One case which I can recall easily is of a night when physical backup of my database started using MEB/PEB (MySQL enterprise backup and Percona xtrabackup) which takes the exclusive lock in the initial phase and last phase of backup for a defined amount of time. During this time all the queries goes in a waiting state and when I checked in the show process-list, it says “waiting for meta data lock”. One more case which i can recall is the contention among various threads while writing in to the binary cache and binary log. Such locks are called as mutex lock and can be catch from the various tables of performance schema in MySQL. Imagine a real situation when your live database is running with high number of connections and your load is CPU bound and you met with such a situation where your queries are being slowed down due to the locks already being acquired by other transactions and you want to make sure that the business should not be impacted anyhow, understanding these types of locks will help you to eliminate the weird situation you can be in.
In a highly concurrent environment where threads are competing with each other to gain resource access, locking needs to be properly implemented on all the databases in an instance and objects including table, data, cache, buffers, files etc. In MySQL locks can be at table level as well as at row level locks (multi-granular locking) and at the memory level. These locks needs to be implemented in order to maintain data consistency and to reduce the contentions. Now some locks can be user managed (like shared and exclusive locks) and some are system managed. In system managed we have mutual exclusion or say mutex .
Mutex also works as a exclusive lock so that one thread can access a particular memory resource or a file (for example binary logs) at a time so that other threads which are requesting for same resource doesn’t interrupt its task and once thread complete its task it will release the lock and other thread/s which is/are waiting in queue will take over. Hence main thread will acquire mutex first and then it performs the required task and release the lock. One of the example of mutex is binary log. In case of syn_binlog > 1 , there is always one leader thread which is responsible for flushing the bin log cache to disk after the n number of group commit and other threads are follower. Leader thread will take the mutex lock and release it once data get flushed on the disk.
mysql_mutex_lock(&LOCK_log);

    DEBUG_SYNC(leader->thd, "commit_after_get_LOCK_log");
    mysql_mutex_lock(&LOCK_group_commit_queue);
    current= group_commit_queue;
    group_commit_queue= NULL;
    mysql_mutex_unlock(&LOCK_group_commit_queue);

//// I have taken this snippet of mutex from Percona mysql code from git hub.
I have copied this line from mysql document page i.e.
“SHOW ENGINE INNODB MUTEX displays InnoDB mutex and rw-lock statistics”
Sample output showing all rwlock . For mutex lock only mutex will be shown.
Apart from this, mutex status can be monitored from the Performance schema as well. In later section you will see which INSTRUMENT is responsible for enabling mutex and which table is responsible for mutex monitoring.
for (ulint i = 0; i < n_sync_obj; i++) {
        rw_lock_create(hash_table_locks_key, table->sync_obj.rw_locks + i,
                       level);
      }
////  This is a snippet of hash0hash.cc where rwlock is created.

/// In mysql doc it has been mentioned that for mutex it will report only Mutex name but for rwlock it will mention file name as well as line number. I believe they should mention same for mutex as well as it will really help alot.
For mutex we have 223 instruments for different purpose and corresponding table to check for mutex lock is performance_schema.mutex_instances.
Related instruments for mutex can be found from setup_instrument table with wait/synch/mutex/ and can be enabled dynamically. I am trying to re-produce the mutex locking scenario which I will add once I have some data. For now it can be understand that table “events_waits_current” in performance can help in analysing the mutex lock.
Meta-Data locks
What is metadata lock ?
Metadata locks helps us in acquiring a lock on table structure so that if a thread is in some transaction (i.e. begin and end transaction) and if there is another thread waiting for same resource to alter the structure of the table then the requesting thread will come into the meta data lock mode. Such scenarios can really hamper the database performance in a production environment. Think of a scenario where your application has started a transaction :
Session 1Session 2SESSION 3 ( from show processlist;)
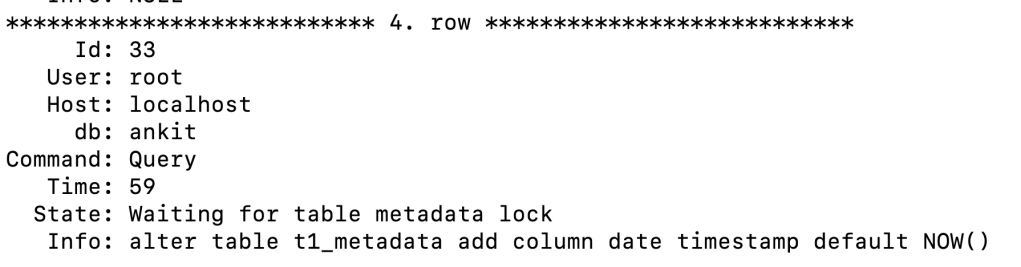
With the help of show processlist it is visible that the requesting thread is waiting for the meta data lock to be released from the other thread. But problem is it is not easy to locate which thread is holding the lock ,not even SHOW ENGINE INNODB STATUS really help. But Performance schema and sys schema will be helpful here . Let us see how :
PSI_stage_info MDL_key::m_namespace_to_wait_state_name[NAMESPACE_END] = {
    {0, "Waiting for global read lock", 0, PSI_DOCUMENT_ME},
    {0, "Waiting for backup lock", 0, PSI_DOCUMENT_ME},
    {0, "Waiting for tablespace metadata lock", 0, PSI_DOCUMENT_ME},
    {0, "Waiting for schema metadata lock", 0, PSI_DOCUMENT_ME},
    {0, "Waiting for table metadata lock", 0, PSI_DOCUMENT_ME},
    {0, "Waiting for stored function metadata lock", 0, PSI_DOCUMENT_ME},
    {0, "Waiting for stored procedure metadata lock", 0, PSI_DOCUMENT_ME},
    {0, "Waiting for trigger metadata lock", 0, PSI_DOCUMENT_ME},
    {0, "Waiting for event metadata lock", 0, PSI_DOCUMENT_ME},
    {0, "Waiting for commit lock", 0, PSI_DOCUMENT_ME},
    {0, "User lock", 0, PSI_DOCUMENT_ME}, /* Be compatible with old status. */
    {0, "Waiting for locking service lock", 0, PSI_DOCUMENT_ME},
    {0, "Waiting for spatial reference system lock", 0, PSI_DOCUMENT_ME},
    {0, "Waiting for acl cache lock", 0, PSI_DOCUMENT_ME},
    {0, "Waiting for column statistics lock", 0, PSI_DOCUMENT_ME},
    {0, "Waiting for resource groups metadata lock", 0, PSI_DOCUMENT_ME},
    {0, "Waiting for foreign key metadata lock", 0, PSI_DOCUMENT_ME},
    {0, "Waiting for check constraint metadata lock", 0, PSI_DOCUMENT_ME}};


//// These are the metadata lock threads states which can be find in mdl.cc
Corresponding instrument for meta data locks for waiting queries which is enabled by default under setup_instrument table is:
wait/lock/metadata/sql/mdl
There are other instrument as well for metadata lock and corresponding table for metadata lock is performance_schema.metadata_locks
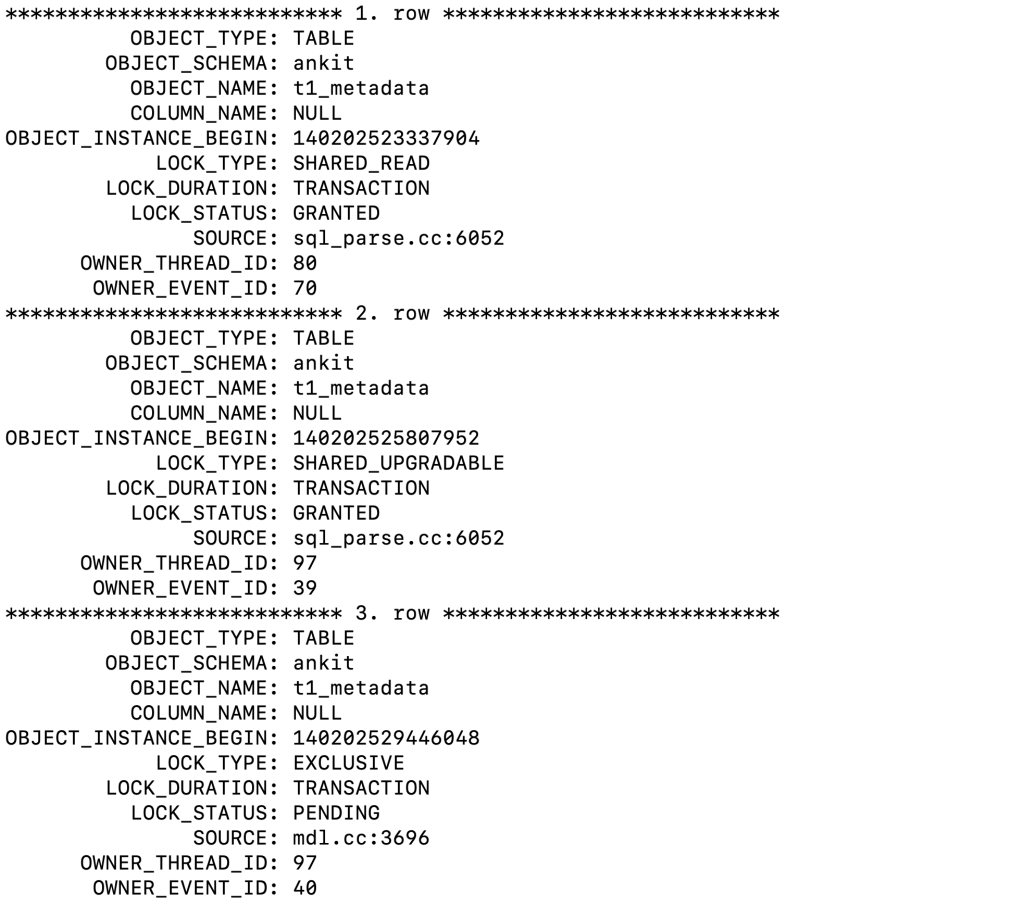
We can find the thread which has acquired the metadata lock for above transaction:
SELECT * FROM metadata_locks; will only show the real or current rows and will be purged out when resolved.
column lock_status tells whether lock has been granted or in pending state. OWNER_THREAD_ID 97 is in PENDING STATE and the corresponding lock is with OWNER_THREAD_ID 80 which is holding SHARED_READ lock on database ankit and table t1_metadata. Taking the advantage of thread table in performance_schema can further be helpful to deep dive by selecting the rows with thread 80 and 97.
if you see here : thread_id 97 with process_id 33 (connection id from processlist ) is waiting for meta data lock from thread id 80
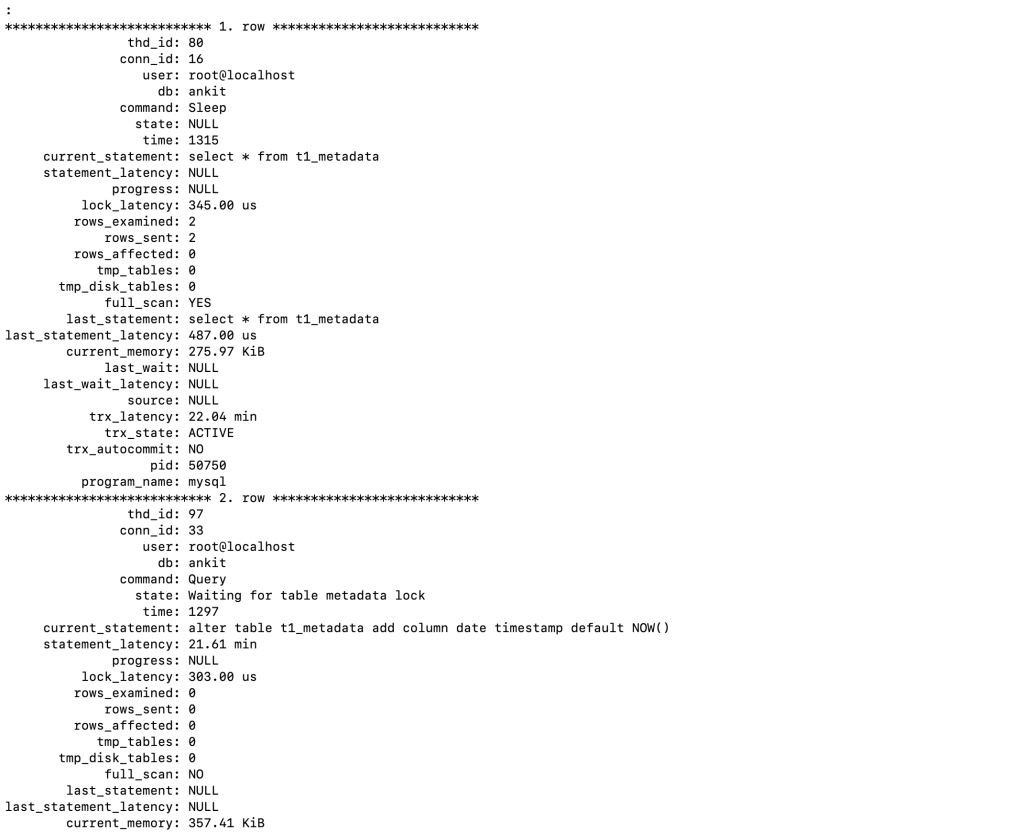
Hence 80 is the thread which is holding the lock since 474 seconds and corresponding thread is waiting for 456 seconds. Even to have more deep dive it is beneficial to use sys.session
output from sys.session
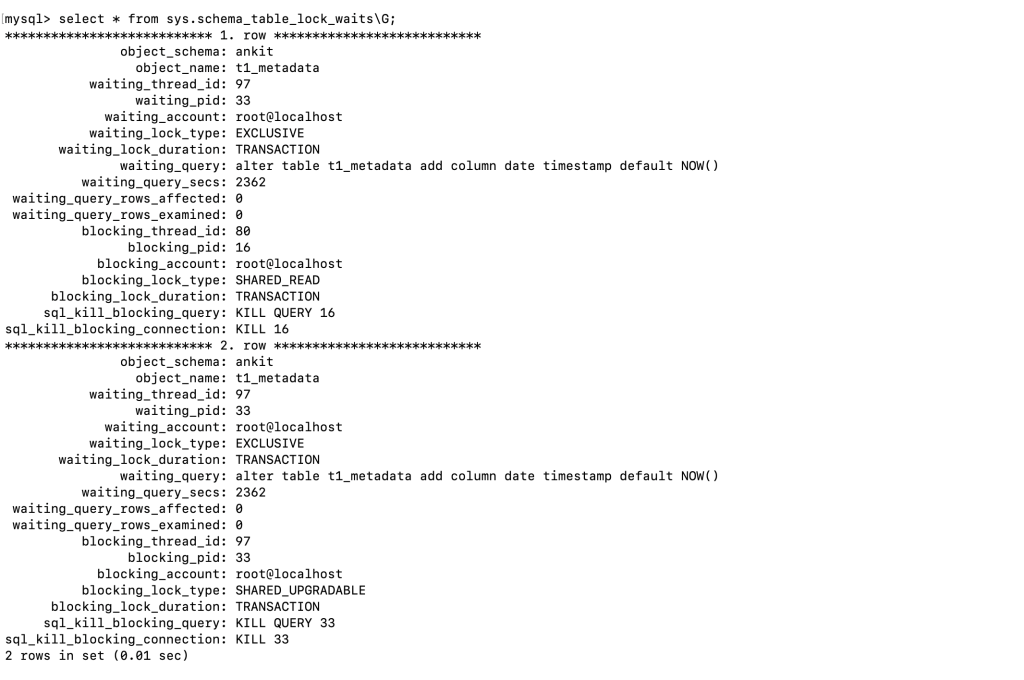
Combining all the above information in sys.schema_table_lock_waits can finally provide the solution to overcome this locking :
schema_table_lock_waits can tell us what action to be taken in order to resolve above meta data issue by referring the column sql_kill_blocking_query.
Some basic concepts and variables of MySQL should be known while handling this in real environment:
1. lock_wait_timeout 2. Type of isolation 3. query_time
Understanding how lock works in mysql is a key concept behind database performance.
This article is in continuation of my previous article on my journey from relational to distributed database. Also I talked about probabilistic data structure here. While discussing distributed databases with one of my colleague, I realised that we often miss focusing on basics and then I decided to publish this article in most simplest form.…
As you know that MySQL 5.7 is going to be in its end of life this month (when I wrote this article) and many businesses are upgrading to 8 ( except few ones, believe me its true) . Many cloud vendors are providing extra support and time to their customer so that they can move…
This article is purely based on my understanding of Components and the outcome of my dirty hands. Reference of this Article is “MySQL official documents” & my experience with components.
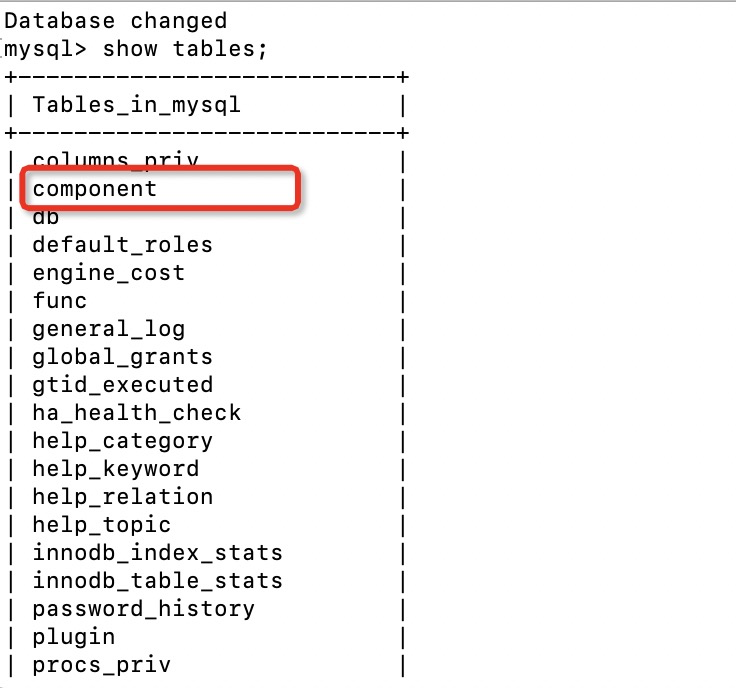
Oracle introduced Components in MySQL 8.0 and user can locate its table under mysql database. See below figure.
What is a component and why we need it ??
Components are similar to the Plugins but are more secure and provides improved & additional features. Moreover plugins will be deprecated in future versions.
If we want “audit logs” to be enable or have strong password mechanism, a user need to install respective plugins. But there are few challenges :
1. Plugins can interact only with server but not with each other which limits its usage.
2. Plugins interact directly with server components which means they are not encapsulated .
3. While installing plugins a user needs to mention the extension file name as well. For example .so or .dll
These are some of the over head or disadvantage of plugins which a DBA normally face. I remember once I required to install an “audit” plugin and being on linux platform , it requires a “.so” file . So in this case I made ensure that I should have “.so” extension plugin .
But components remove above mentioned challenges. Components are more secure as it is encapsulated and provides defined set of services. Major advantages are :
1. Components can interact each other.
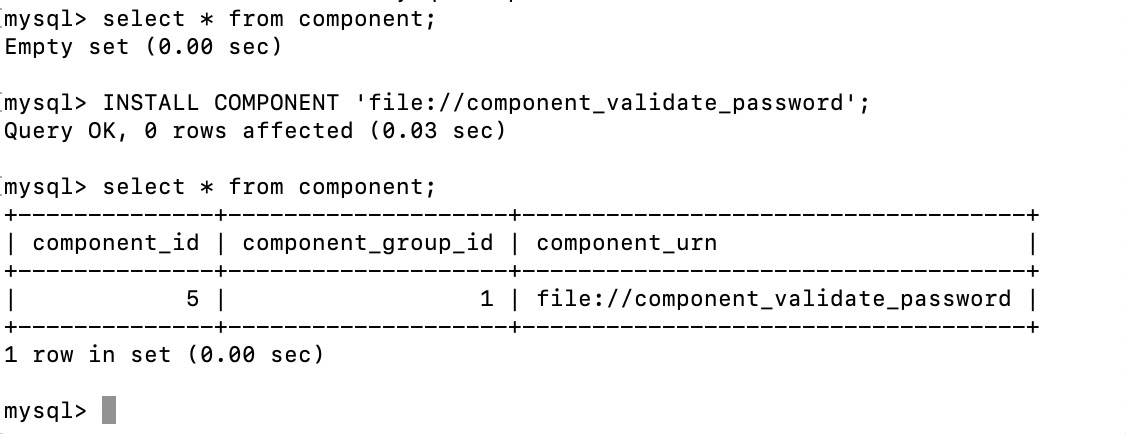
2. With components DBA doesn’t need to worry about remembering the extension file name. For example while installing “validate password” component user can simply install it as shown in below picture post which a user can check whether component has been successfully installed . Additionally we can uninstall if not required.
3. A user can create his own plugins using existing macros . Some of the header for this component are as follows :
3.a After this, copy any macros of existing components and get the basic framework ready.
3.b Copy any of the service ( header file) and compile it using the source distribution of the MySQL server.
Currently below plugins are available to use. At the current moment not all components are available and thus plugins can be used in place but in future, plugins will be completely removed.
Error logging
Audit Messaging and logs
MySQL Enterprise Data Masking and De-Identification Password Validation
MySQL Enterprise Firewall
Plugin API
Thread Pool
Version Tokens
Once enable, user can see the respective variables using “show global variables” .
Such variables starts with prefix “component name”. For example in “validate_password” , below are the variables which will be visible once user enable this component :
What about “Audit log” component & how it is useful ??.
There are various cases when application need to append some specific string in audit logs. In such case we can use an UDF which is known as “audit_api_message_emit_udf()”.
First install “audit log” component in similar manner which we used to install validate password component:
2. Now we wanna check if we can add some message to the audit log:
Hence stating this we have other components too, we can make our own also and in future it will replace the plugins. Moreover if are using plugins these days and planning to work on MySQL 8 , then you have to remove plugins as it will be going to remove in future.
While working on Performance schema for my customers, I have realised the importance of sys schema which is rarely being used. In this blog, I will cover 2 articles on “SYS” schema. SYS schema is used to monitor your database performance and facilitates easier way to use instruments and consumer.
You can find sys schema in MySQL 5.7 by querying :
show databases;
“SYS” schema is introduced in 5.7+ versions default . In previous versions : we need to download from GITHUB:
Previously, this sys schema was known by ps_helper which was deigned by Mark Leith.
SYS schema is a collection of various objects i.e. Procedures, functions, Triggers,Views etc which help us to gather information required for troubleshooting issues like slow queries or inspection of any instrument and can be diagnosed based on the gathered information.
So, when i say view, I mean that in “sys” schema we have varieties of views which are derived from Performance schema’s tables. For example : host_summary_by_file_io
When i say procedures , i mean sys schemas has various procedure which allow us to perform various task . Take example of “create_synonym_db(‘db_name’,‘synonym_name’)“. This procedure creates a duplicate database with all the objects present in it.
When i say function , i mean sys schemas contains various functions to achieve a specific task. Take an example of “extract_schema_from_file_name“
So if i want to know schema name of a particular data file , i can use this function . For example:
In Introduction to Instruments I have covered what instruments are (which is a part of performance schema), how they look like and where can you find it in i.e. setup_instruments table of performance_schema. I have also covered how a DBA can make use of it . There are 1016 set of instrument in MySQL 5.7.17 which is more than what we have in 5.6. A DBA can enable/disable them as per your needs.
In structure of this table there are 3 columns i.e. Name,Enabled,Timed
mysql> show create table setup_instruments;
+-------------------+--------------------------------------------------------
| Table | Create Table |
+-------------------+--------------------------------------------------------
| setup_instruments | CREATE TABLE `setup_instruments` (
`NAME` varchar(128) NOT NULL,
`ENABLED` enum('YES','NO') NOT NULL,
`TIMED` enum('YES','NO') NOT NULL
) ENGINE=PERFORMANCE_SCHEMA DEFAULT CHARSET=utf8 |
+-------------------+--------------------------------------------------------
1 row in set (0.00 sec)
So we have multiple instruments, like I pasted below for alter_db, drop_function, repair etc. For these instrument we can check why it is taking time and where the query is spending most of the time.
Hence we can check which instruments are enabled as shown below:
mysql> select * from setup_instruments where ENABLED ='YES';
+----------------------------------------------------------------------------
| NAME | ENABLED | TIMED |
+--------------------------------------------------------------------------------+---------+-------+
| wait/io/file/sql/map | YES | YES |
| wait/io/file/sql/binlog | YES | YES |
| wait/io/file/sql/binlog_cache | YES | YES |
327 rows in set (0.00 sec)
To enable all these instrument , please ensure that performance_schema must be ON :
mysql> show global variables like '%performance_schema%';
+----------------------------------------------------------+-------+
| Variable_name | Value |
+----------------------------------------------------------+-------+
| performance_schema | ON |
+----------------------------------------------------------+-------+
Now , there is one more table known as setup_consumers, which provides the information stored about “”instrument”” . What i mean by this is “What kind of data will be stored in the related ( BY RELATED I MEAN , WHAT KIND OF DATA WILL BE LOGGED TO MONITOR THE PERFORMANCE IN TABLE)”.
In below table, only event_statement_current and event_statement_history is turned ON which means all information related to DDL/DML statement will be logged.
mysql> select * from setup_consumers;
+----------------------------------+---------+
| NAME | ENABLED |
+----------------------------------+---------+
| events_stages_current | NO |
| events_stages_history | NO |
| events_stages_history_long | NO |
| events_statements_current | YES |
| events_statements_history | YES |
| events_statements_history_long | NO |
| events_transactions_current | NO |
| events_transactions_history | NO |
| events_transactions_history_long | NO |
| events_waits_current | NO |
| events_waits_history | NO |
| events_waits_history_long | NO |
| global_instrumentation | YES |
| thread_instrumentation | YES |
| statements_digest | YES |  < -------------- This is useful , we will cover it in this chapter.
+----------------------------------+---------+
So in above output, we can see that event_statement_current and event_statement_history is turned ON, which means current and historical data will be saved. So very soon we will see what these tables will show us. Please note that for every monitor, performance_schema has respective tables.
Please note that all these “instrument” are event name in events table. Lets select some records from one of the event table events_statements_current and try to understand what information it provides:
mysql> select * from events_statements_current limit 1\G;
*************************** 1. row ***************************
THREAD_ID: 807336 <- This is Thread ID
EVENT_ID: 23739
END_EVENT_ID: 23739
EVENT_NAME: statement/sql/set_option ##### "This is instrument name" .
SOURCE: socket_connection.cc:95 ###### This is source code (https://github.com/bjoernv/mysql-packaging)
TIMER_START: 591734569357461000 ###### Start Time in PICO SECOND.
TIMER_END: 591734569450550000 ####### End time in pico second
TIMER_WAIT: 93089000 ###### Waiting time in pico second
LOCK_TIME: 0 ######## lock time in pico second
SQL_TEXT: SET autocommit=1  ###### Query
DIGEST: 54b0116d21e24f638f94bd799148b397
DIGEST_TEXT: SET `autocommit` = ?  ###### Shows same output for other values in SQL
CURRENT_SCHEMA: cim_user2
OBJECT_TYPE: NULL
OBJECT_SCHEMA: NULL
OBJECT_NAME: NULL
OBJECT_INSTANCE_BEGIN: NULL
MYSQL_ERRNO: 0
RETURNED_SQLSTATE: 00000
MESSAGE_TEXT: NULL
ERRORS: 0
WARNINGS: 0
ROWS_AFFECTED: 0
ROWS_SENT: 0
ROWS_EXAMINED: 0
CREATED_TMP_DISK_TABLES: 0
CREATED_TMP_TABLES: 0
SELECT_FULL_JOIN: 0
SELECT_FULL_RANGE_JOIN: 0
SELECT_RANGE: 0
SELECT_RANGE_CHECK: 0
SELECT_SCAN: 0
SORT_MERGE_PASSES: 0
SORT_RANGE: 0
SORT_ROWS: 0
SORT_SCAN: 0
NO_INDEX_USED: 0
NO_GOOD_INDEX_USED: 0
NESTING_EVENT_ID: NULL
NESTING_EVENT_TYPE: NULL
NESTING_EVENT_LEVEL: 0
1 row in set (0.00 sec)
Taking an another example of its usage, in case we want to see all those current queries which has lock_time > 0 below query will give us the data and then we can optimise the query mentioned in SQL_TEXT.
select * from events_statements_current where lock_time > 0;
Let’s evaluate statements_digest . This is very useful tool in identifying slow queries if queries are not using index, how much time this query ran etc.
*************************** 1. row ***************************
SCHEMA_NAME: ABC
DIGEST: 83b9e1dc432459828ed9a4d65aef7efe
DIGEST_TEXT: SELECT `A` , COUNT (?) FROM `ABC` . `C` WHERE `ID` IN (...) GROUP BY `ID`
COUNT_STAR: 4283945 <-------- This query ran this number of time.
SUM_TIMER_WAIT: 12795126000
MIN_TIMER_WAIT: 12795126000
AVG_TIMER_WAIT: 12795126000
MAX_TIMER_WAIT: 12795126000
SUM_LOCK_TIME: 1068000000 <----- Total lock time
SUM_ERRORS: 0 <- No errors
SUM_WARNINGS: 0
SUM_ROWS_AFFECTED: 0
SUM_ROWS_SENT: 4
SUM_ROWS_EXAMINED: 357 <-- number of examined rows
SUM_CREATED_TMP_DISK_TABLES: 0   <--- if any temporary tables
SUM_CREATED_TMP_TABLES: 1
SUM_SELECT_FULL_JOIN: 0 <---- Full joins
SUM_SELECT_FULL_RANGE_JOIN: 0 <--- Full range join
SUM_SELECT_RANGE: 1
SUM_SELECT_RANGE_CHECK: 0
SUM_SELECT_SCAN: 0
SUM_SORT_MERGE_PASSES: 0
SUM_SORT_RANGE: 0
SUM_SORT_ROWS: 4
SUM_SORT_SCAN: 1
SUM_NO_INDEX_USED: 0 <- No index used
SUM_NO_GOOD_INDEX_USED: 0
FIRST_SEEN: 2018-05-25 16:35:38 <- Query ran first time
LAST_SEEN: 2018-05-25 16:35:38 <- Query ran last time
This is equivalent to pt_query_digest tool from Percona tool kit.
So now it is easy to keep track of various queries before putting it in production and we can monitor as well and in this way you can enable / disable instrument using below command :
update setup_instruments set enabled='NO' where name like '%IO%';
Taking one more example, now i want to check most frequent events waiting. For this we have table :
mysql> select * from events_waits_summary_global_by_event_name where count_star >0 order by count_star desc limit 1\G;
*************************** 1. row ***************************
EVENT_NAME: wait/io/table/sql/handler
COUNT_STAR: 42057624429
SUM_TIMER_WAIT: 77766263675607248
MIN_TIMER_WAIT: 51448
AVG_TIMER_WAIT: 1848640
MAX_TIMER_WAIT: 227940787813800
Taking another example of most frequent time a FILE has waited. Below query shows, most frequent file event in READ. So in this example innodb_data_file read most:
Update – “setup_timers” table has been depreciated and is removed in MySQL 8.0. This blog is covering the details for 5.7/8.0/9.4. There might be some changes that reader can expect in 8.0 and 9.4
Blog starts from this point –
This is a two article series on Instrument in MySQL. This is the first one and second one can be read from here
Instrument are the main part of performance schema . Well, it is useful in cases when i want to dive inside a problem . For an example, if i want to check what IO operation is causing my DB slow down or what file a process is waiting for or what stage is taking time, which connection is expensive etc.
But this is also true that enabling them , affects mysql performance. Hence you need to follow strategy as per your needs.You can enable all of them while in testing environment and can tune your queries or can enable few of them in production environment to monitor your DB performance.
Instruments are combination of different set of components like wait/io/file/sql/binlog.Instrument start from general and get more deeper. We can identify how specific are they by the length of the name of instruments.
I can check all instrument from performance_schema.setup_instruments table whether they are enabled or not. There are thousand of instrument which are responsible for representing different activities.
—-Update—
There are more than 600 such instruments for different purposes in MySQL 5.7
like for sql binlog, innodb_data_file,replication,page lock, mutex lock,select,delete,show privileges , load,copying to tmp table.
So every instrument is not enabled, but we can enable it and can check which is enabled by executing below query :
select * from setup_instrument where enabled='Yes'
We have one more table which is setup_consumer which tells you how much data you would like to save . By this i meant , history or current data.
If we check in setup_timers table , we find different component there which are prefix in all instrument , like below :
1. Idle ( microcycle)
2. Stage (cycle)
3. Statement (nano)
4. Wait (nano)
Idle will give internal information on socket connection and information related to a thread like how much packet has been transferred .
Stage tell the execution stage of any query like reading data, sending data, altering table, checking query cache for queries etc. Instrument for this can be represented as stage/sql/altering table.
Statements are related to sql,abstract,com which i will give more information later.Instrument for this can be statement/sql/select.
Wait , as the name implies all the wait operation comes here. Like mutex waiting , file waiting, I/O waiting ,table waiting.Instrument for this can be wait/io/file/sql/map.
Instrument should alway be read from left to right.
In the next session , i will cover how it helps in improving your database performance. Please be aligned.
Your comments are welcome.
About Ankit Kapoor
Ankit Kapoor is a database geek and enjoy playing with open source databases like MySQL and PG. Connect with me on linkedin
In one of the real production scenario, I have faced a situation where the disk of underlying data directory was used upto 90 % and this disk size cannot be increased. Hence the only option left was to add the new disk but in mysql (before 8) we really don’t have any option to create multiple data directories and can only be one at that moment. Challenges of this approach has been mentioned in the last of this article.
Data file of an innodb table in background has been represented by .ibd file when innodb file per table is enabled. If it is not enabled then either data of this table will reside in system tablespace i.e. ibdata01 or in user defined table space which can be created by ‘create tablespace’.
In this paper, I am considering that innodb file per table is enabled. In Mysql, we define data directory in cnf file which remains default for every table until we don’t specify data directory parameter while creating the table which is like below :
create table table_name(table def) data directory =‘new one’;
When this table get created I see a .isl file of this newly created table (say test.isl ) in the default data directory which contains path of ibd file (say test.ibd ) of this newly created table. So this is typically like a symbolic link of linux.
So, this is done and we can put our new table to another location apart from default one. But problem started when I wanted to move my ***existing table*** to the new location.
Simple option is to re create this table with new data directory and take dump and restore which is a time taking approach.
Now to solve this, I made use of this “isl” file which can be easily understand by mysql. On creation of normal innodb table we have ibd and frm file only.
I have a table test and data file as test.ibd, and test.frm as definition which resides in /default_data/data mount point. As per requirement, i want to move this table in new mount point i.e. /new_data/data .
So, firstly i make a isl file like this :
echo ‘/new_data/data/test.ibd’ > /default_data/data/test.isl

(you can also create this isl file in some other data directory at this step & later copy it into data dir)
Once it is down move the test.ibd file to the new location
mv test.ibd /new_data/data/
if you have put isl file in different location then move isl file to default data directory :
mv test.isl /default_data/data/
make ensure that owner of isl file is mysql and if it is not then mysql cannot recognize this table and will throw error that table space of this table is missing.
Now restart the mysql and check if table is accessible. If in case your table is not accessible , then it is purely permission and ownership related issue.
This method is the best possible to reduce downtime when you are in production.
Challenges with this approach
During the time of alter table, this might create some issues because the location of the ibd file in frm and ibdata is registered as the default data directory. Hence this should be taken into account while implementing this approach.
About Ankit Kapoor
Ankit Kapoor is a database geek and enjoy playing with open source databases like MySQL and PG. Connect with me on linkedin
IN INNODB , EVERYTHING IS DESIGNED IN B-TREE. When I say everything I mean primary key, Indexes, secondary index.
But have we ever thought how MySQL creates an index ? Obviously I am not saying by syntax “create index” or “alter table”. Let’s begin to start from an example by what I mean. Say, I have to create an index on table T1 having column ID with million of records in it. In prior version, mysql uses insert APIs and then index entries were inserted into the B-tree one by one. This is a traditional method to insert data in b-tree .
If there is no space in page , then pessimistic insert would be performed .For this , b-tree cursor (btr0btr.c) will need to open again and split the page and merging will be done.
This is a top down approach and it is costly because of multiple opening of b-tree cursor, searching, splitting and merging of b-tree nodes
Bottom up approach :
Lets divide new approach in 3 phase to understand :
Run phase:
a. In the run phase, Clustered or Primary index has been scanned or read, post which these entries get added to the buffer , known as sort buffer (innodb_sort_buffer_size) with default size of 262144 bytes. Until this, sorting hasn’t been done. So, you can tune this variable according to your data size to speed up the index creation. Once this buffer becomes full , all the records will be sorted and put it in a temporary file (which is explained further in the second part of this process). In addition to sort buffer size, max_sort_length also needs to be modified whenever we are making changes in sort buffer. Remember here, I am talking about the sort_buffer_size , not the innodb_sort_buffer_size. However, when dealing with innodb engine and while creation of the secondary index online, innodb_sort_buffer_size should be consider
mysql> show global variables like '%sort_buffer%';

+-------------------------+---------+

| Variable_name           | Value   |

+-------------------------+---------+

| innodb_sort_buffer_size | 1048576 |

| myisam_sort_buffer_size | 8388608 |

| sort_buffer_size        | 262144  |

+-------------------------+---------+

3 rows in set (0.01 sec)

mysql>
2. Second phase :
Multiple temporary files, which got generated in run phase will get merged in this phase using MERGE SORT algorithm. At this stage, multiple temporary files got merged with each other. The amount of merge can be seen under the merge_passes status shown below. This status tells how many temporary files are getting merged and if this number is high enough, then it simply means that the sort buffer size is low and is a good time to tweak it.
mysql> show global status like '%passes%';
+-------------------+-------+
| Variable_name     | Value |
+-------------------+-------+
| Sort_merge_passes | 0     |
+-------------------+-------+
1 row in set (0.11 sec)
3. Third phase :
Once all file got merged , all the sorted records from second phase will be inserted into the b-tree nodes.
What’s next ?
Until this point, all these operations i.e. sort and merge is single threaded but starting from MySQL 8, these operations are now multi threaded. Think about a situation wherein you are trying to add a secondary index in your existing table using online DDL approach and you need to get it done faster or you are trying to count the number of records in a heavy table.
Take an example below to understand, how innodb_parallel_read_threads is making the clustered index read more faster as we increase the number of threads.
mysql> set local innodb_parallel_read_threads=1;
Query OK, 0 rows affected (0.00 sec)

mysql> select count(1) from fact;
+----------+
| count(1) |
+----------+
| 14531072 |
+----------+
1 row in set (2.12 sec)

mysql> set innodb_parallel_read_threads=4;
Query OK, 0 rows affected (0.00 sec)

mysql> select count(1) from fact;
+----------+
| count(1) |
+----------+
| 14531072 |
+----------+
1 row in set (0.92 sec)

mysql> set innodb_parallel_read_threads=1;
Query OK, 0 rows affected (0.00 sec)

mysql> select count(1) from fact;
+----------+
| count(1) |
+----------+
| 14531072 |
+----------+
1 row in set (2.09 sec)
However I don’t see any influential improvement in check tables.
mysql> show variables like '%parallel%';
+------------------------------+----------+
| Variable_name                | Value    |
+------------------------------+----------+
| innodb_parallel_read_threads | 1        |
| replica_parallel_type        | DATABASE |
| replica_parallel_workers     | 0        |
| slave_parallel_type          | DATABASE |
| slave_parallel_workers       | 0        |
+------------------------------+----------+
5 rows in set (0.01 sec)

mysql> check table fact;
+------------+-------+----------+----------+
| Table      | Op    | Msg_type | Msg_text |
+------------+-------+----------+----------+
| ankit.fact | check | status   | OK       |
+------------+-------+----------+----------+
1 row in set (17.53 sec)

mysql> set innodb_parallel_read_threads=4;
Query OK, 0 rows affected (0.00 sec)

mysql> check table fact;
+------------+-------+----------+----------+
| Table      | Op    | Msg_type | Msg_text |
+------------+-------+----------+----------+
| ankit.fact | check | status   | OK       |
+------------+-------+----------+----------+
1 row in set (14.23 sec)

mysql> set innodb_parallel_read_threads=8;
Query OK, 0 rows affected (0.00 sec)

mysql> check table fact;
+------------+-------+----------+----------+
| Table      | Op    | Msg_type | Msg_text |
+------------+-------+----------+----------+
| ankit.fact | check | status   | OK       |
+------------+-------+----------+----------+
1 row in set (14.48 sec)

mysql> set innodb_parallel_read_threads=12;
Query OK, 0 rows affected (0.00 sec)

mysql> check table fact;
+------------+-------+----------+----------+
| Table      | Op    | Msg_type | Msg_text |
+------------+-------+----------+----------+
| ankit.fact | check | status   | OK       |
+------------+-------+----------+----------+
1 row in set (14.35 sec)

mysql> show variables like '%parallel%';
+------------------------------+----------+
| Variable_name                | Value    |
+------------------------------+----------+
| innodb_parallel_read_threads | 12       |
| replica_parallel_type        | DATABASE |
| replica_parallel_workers     | 0        |
| slave_parallel_type          | DATABASE |
| slave_parallel_workers       | 0        |
+------------------------------+----------+
5 rows in set (0.00 sec)

mysql> set innodb_parallel_read_threads=20;
Query OK, 0 rows affected (0.00 sec)

mysql> check table fact;
+------------+-------+----------+----------+
| Table      | Op    | Msg_type | Msg_text |
+------------+-------+----------+----------+
| ankit.fact | check | status   | OK       |
+------------+-------+----------+----------+
1 row in set (14.34 sec)

mysql>
This phase is while scanning the clustered index. Similarly if you are using the 8.0.27, innodb_ddl_threads can be used to speed up the sort and merge operations as explained one. This defines the number of threads to perform sort and merge operation. Here is the below test I performed :
mysql> alter table fact add index idx_dim2(dim2);
Query OK, 0 rows affected (19.41 sec)
Records: 0  Duplicates: 0  Warnings: 0

mysql> set innodb_ddl_buffer_size=10485760;
Query OK, 0 rows affected (0.00 sec)

mysql> set innodb_ddl_buffer_size=104857600;
Query OK, 0 rows affected (0.00 sec)

mysql> set innodb_ddl_threads=10;
Query OK, 0 rows affected (0.00 sec)

mysql> alter table fact drop index idx_dim2;
Query OK, 0 rows affected (0.01 sec)
Records: 0  Duplicates: 0  Warnings: 0

mysql> alter table fact add index idx_dim2(dim2);
Query OK, 0 rows affected (16.03 sec)
Records: 0  Duplicates: 0  Warnings: 0

mysql> set innodb_ddl_threads=12;
Query OK, 0 rows affected (0.00 sec)

mysql> set innodb_parallel_read_threads=12;
Query OK, 0 rows affected (0.00 sec)

mysql> alter table fact drop index idx_dim2;
Query OK, 0 rows affected (0.01 sec)
Records: 0  Duplicates: 0  Warnings: 0

mysql> alter table fact add index idx_dim2(dim2);
Query OK, 0 rows affected (15.89 sec)
Records: 0  Duplicates: 0  Warnings: 0

mysql> set innodb_ddl_buffer_size=1048576000;
Query OK, 0 rows affected (0.00 sec)

mysql> set innodb_parallel_read_threads=16;
Query OK, 0 rows affected (0.00 sec)

mysql> set innodb_ddl_threads=16;
Query OK, 0 rows affected (0.00 sec)

mysql> alter table fact drop index idx_dim2;
Query OK, 0 rows affected (0.01 sec)
Records: 0  Duplicates: 0  Warnings: 0

mysql> alter table fact add index idx_dim2(dim2);
Query OK, 0 rows affected (17.73 sec)
Records: 0  Duplicates: 0  Warnings: 0
With the various combinations, you can see how the performance varies.
What other things needs to consider when creating index in MySQL ?
Now , question is how much space can we reserved for index future growth per page. To achieve this, we have **innodb_fill_factor** option which will help in reserving the space for future b-tree index growth. For an example, if we have set this value to 70, then 30 percent of the space of page will get reserve for index growth during sorted index build.
This setting help us in managing server memory . Sometimes, when data becomes fragmented , setting this option can help in re-gaining it.
Conclusion
This article helps us to understand the core process behind how innodb creates an index and how with the time, things has been improved in 8. Here I have used 2 versions of MySQL to show the results. One is 8.0.26 and 8.0.32 on Mac OS.
The below picture is just a representation of the flow. I created this figure by referring to the picture in percona doc but I don’t follow this picture anymore (I didn’t mean It was wrong) and have created my own one now. You can refer to my video I posted link in next paragraph
I keep on updating this document with the changes or correctness. Last updated on 1st December 2021.
I spoke on InnoDB transaction flow in more detail. Please check here :
Hope you have read my earlier posts as well. If not, you can read those as well (mentioned last ). Also while working on these features, I have found many bugs which I have reported to Oracle as well. One of the bugs, I reported is (https://bugs.mysql.com/bug.php?id=89158). I will try to cover such limitations in my next blogs.
In this blog, I am covering transaction flow and how it can improve DB performance. This blog has been written after reading various MySQL documentation, related snippet code, and joining all the blocks which can make some sense.
At the time of writing, there is no proper document from Oracle which can define this.
So, before going further, it is good if we understand the following terminology :
Buffer pool – Cache area of holding cached data . It is main part of MySQL and we allocate usually according to our business requirement.
log buffer – buffer for redolog files which keeps the data coming from MTR buffer.
redo logs – iblogfile
undo logs – undo files
tablespaces – ibdata
data files – ibd
check points
fuzzy check point
sharp check point
flush
overflow
commit
binary logs
sync binlog
innodb adaptive flushing.
MTR transaction.
MTR buffer
Flush list
Flushing methods
double write buffers
Change buffers
list – double linked list
Let us try to understand this in the following way :
Select – When a user execute select query , data comes from table space and get loaded in the buffer pool . So at this point of time , complete data from table space ( i mean ibd file) doesn’t get loaded in buffer pool and only “data matching criteria” gets loaded ( also much depends on the what read ahead algorithm have been used). By matching criteria I meant, only required pages get loaded and root of the index is always in cache for open table. Here number of read io threads, type of read ( linear,random) and threshold value matters which I may try to cover in my future post as a part of read optimisation.
2. DML statement – In such cases, suppose we received an “insert into table_name” , it goes to log buffer and buffer pool simultaneously . After log buffer, it goes to log file ( which is redo log files and knows as ib_logfile0,1). Journey of this transaction from log buffer to log file will depend on innodb_flush_log_at_trx_commit. If it is 1 then at each transaction commits , tx will write and get flush to redo log (log file) .With this value , we are ensuring that chances of loss for any transaction is minimal in case of any crash and thus this value is safest . But I/O will be high due to write at each tx commit . To flush this data into disk ,OS will take care when to flush . Also , to flush this data into disk , innodb_flush_log_at_time_out (which is in seconds ) plays important role . By default , it is 1 second and at every second data got “flushes to disk” . Please note by “flushes to disk” I don’t mean data gets written to data file , rather i mean ib_logfile using different flushing method. I will try to cover these 2 parameter in my future post but you can refer mysql documentation on this. So , you can try using different values for these parameters and choose what suits your MySQL server.
In start of this , i mentioned that , data goes in buffer pool as well . Buffer pool load a page from tablespace and also uncommitted version of data (to ensure MVCC) which is stored in undo tablespace .By uncommitted version , i mean the historical data (in case of update,delete so that we can rollback from and ensuring high performance) .This undo tablespace gets loaded in buffer pool and ensure that MVCC practice must be followed. Once this transaction get committed , dirty pages will get flush to “data file” from buffer pool (which now host the commited version of data instead of undo) and thus marks the check point.By data files , i mean where your data resides i.e. *.ibd files . This process of flushing the data ( dirty pages ) ,is known as fuzzy check point.
In reality , writing to disk gets more complex as we proceed further because Check point, overflow and commit follows different threads.I will try to make you understand in short and descriptive manner :
Check point : At various intervals , innodb marks check point in buffer pool for dirty pages to flush out , preventing buffers to get filled up.
Over flow – This is the rare case when buffers get fill and innodb needs to make space . If log buffer is filled , then it will over write the LRU data and if data buffer is full , then it compares the LSN of data buffer with log buffer and if it is greater then , innodb will write the log records.
Commit : By just commit , it never mean that data will write dirty pages to disk. We need to remember that at very first point of time , data goes write in redo log first instead of data files because even if we face crash , data resides in redo files and can be recovered from that and this process is knows as WAL ( Write ahead logging )
I have rarely seen dev/DBA using this concept when their query is busy in FTS or index scanning. I have decided to write my own experience here and share it with the outer world. It might help someone who is struggling with their query performance.
In many cases, you have experienced slowness in your select queries even instead after having had an index on the column present in where clause and you are using an in-built function like substring, like, max, min, etc. Please note I’m talking about inbuilt functions only not user-defined functions.
show create table list:
Create table (id int, name char (20)),primary key (Id) ,Key idx_name(name) engine=Innodb;
Now insert at least 1 million records so that we can easily understand the performance impact :
Now if your query is like :
select id,name from list where id=123 and name =’oggy’;
This query will use index idx_name and will give you output in less than a second.
But if your query is like ;
select id, name from list where id=123 and name like ‘%abc%’;
With more than one million records this query will perform FTS (full table scanning) on the name column and will not use the index in spite name column has a secondary index on it and this may take a lot of time depending on the number of records in the table.
Fact is function never use indexes, even if involved column has index created on it and always result in FTS.
Prior to MySQL 5.7, MySQL doesn’t provide any functional-based indexing feature or something similar to it.
In 5.7, we have virtual columns feature which is known as generated columns and can be built at the time of reading data, thus resulting in no consumption of storage space.
Let’s begin with our earlier example where our query was doing FTS. Now if i create a virtual column :
alter table list add name_virt char (10) as substring(name,3,9);
So instead of evaluating at the application level, DB will take care of this. Moreover, we can create an index on these virtual columns. So, if I create an index on this newly created column( I am trying making use of the online DDL, you can choose your own) :
create index idx_name_virt on list(name_virt) algorithm=inplace lock=none;
Once the index has been added, please run the same select query and you will observe that instead of consuming more than 4-5 minutes (suppose), your query will yield a result in less than a second.
If you want to store these values in the table, then you can use the STORAGE keyword while adding a column. But by default, it remains virtual. In my experience, my queries that were taking more than 4 seconds are now taking millisecond only.
Please be informed that performance depends on how heavy evaluation we are doing. If we are doing heavy evaluation then performance may get impacted because of several IO. So we need to decide as per our requirements.
Below is the clause of virtual column from mysql docs:


You must be logged in to post a comment.