Hash partitioning and its role in distributed systems – 1

Have you ever divided a single physical book into rather sub-books because the book was too heavy and it is not even easy to quickly navigate to a specific page?

Similarly, partitioning a table is like you are dividing one physical table into various sub-tables (on the same storage and same data directory) to have better storage management, better performance (in some cases), and better archival policies. We can partition a table in various ways. The process is, first we have to choose a partitioning key or partitioning keyS i.e. a composite partition key in which multiple columns are involved. By partitioning key I mean we need to choose a column/columns basis on which we can divide the table.

Let’s say we have the below popular table employees_range. This table is divided into two sub-parts i.e. p0 and p1. If you insert a record with an id less than 100, that particular record will insert in the p0 partition. This is the simplest form of partitioning we can have in our database server and is known as range partitioning. However such type of partitioning has already been covered by multiple articles and is not a topic to be covered under this article.

Whenever you are creating a partition, table structure matters a lot. For example, if you have a primary key and a unique key in the table and you are planning to partition your table, then the partition key should be present in all the keys i.e. either a unique key or as a primary key.

This blog is focused on hash partitioning. If you will understand this, you can also replicate your understanding in the distributed systems where database is sharded into several shards and you can also understand that how data is being written into the respective shards.

Hash partition :

create table t1 (col1 int not null,col2 date not null,col3 int not null,col4 int not null,unique key(col1,col2,col3)) partition by hash(col3) partitions 4;

This will divide the table into 6 different sub tables.Numeric 6 means the number of partitions we need. In hash partitioning we doesn’t define the path of data explicitly (by path of data I mean, in which partition, a particular insertion shall take place) as we do in the range partitioning. Hash is a function in computer science/math which transforms an arbitrary string into a fixed size of output.

Now hashing can be of different types.

MySQL, by default uses modulous hashing (linear hashing is different) i.e. x % y where x is the value of partitioning key and y is the number of partition . For example 9 % 5 which means divide 9 by 5 will give remainder as 4 so that will be the hashing. Similarly in above example hashing will be based on the col3 values. Lets try to insert some value

mysql> insert into t1 values (1,NOW(),300,1);
Query OK, 1 row affected, 1 warning (0.00 sec)
mysql> insert into t1 values (1,NOW(),191,1);
Query OK, 1 row affected, 1 warning (0.01 sec)

mysql> insert into t1 values (1,NOW(),0,1);
Query OK, 1 row affected, 1 warning (0.00 sec)


mysql> select * from t1 partition(p3);
+------+------------+------+------+

| col1 | col2       | col3 | col4 |

+------+------------+------+------+

|    1 | 2024-04-01 |  191 |    1 |

+------+------------+------+------+

1 row in set (0.00 sec)

mysql> select * from t1 partition(p0);
+------+------------+------+------+

| col1 | col2       | col3 | col4 |

+------+------------+------+------+

|    1 | 2024-04-01 |    0 |    1 |

|    1 | 2024-04-01 |  300 |    1 |

+------+------------+------+------+
2 rows in set (0.00 sec)


300/4 = 0 , so that means data will insert in the first partition.
191/4=3, this will go in 3rd partition
0/4=0, this will go in first partition.

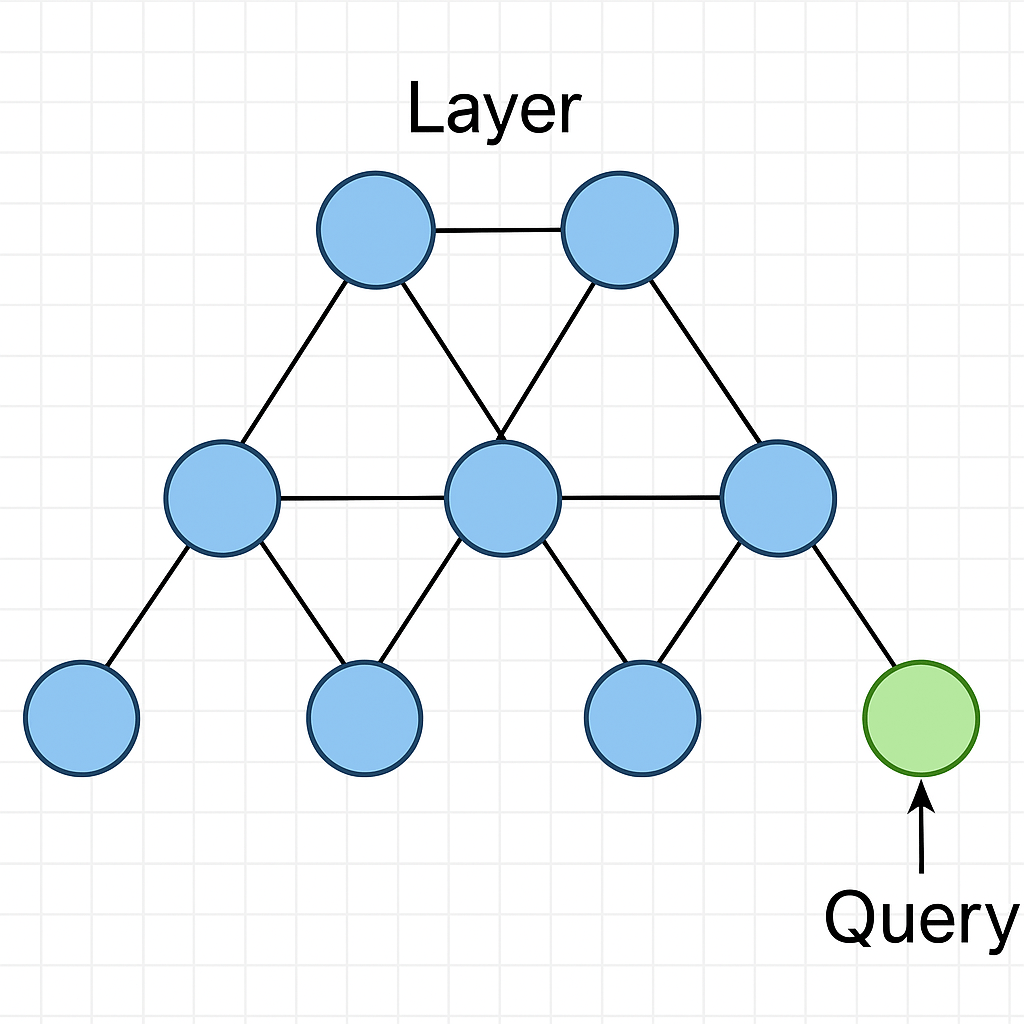
This is the most simplest form of partitioning you will encounter. Same concept can also be applied on multi-tenant databases where databases or tables has been sharded into different servers. See this diagram below


Choosing the definition of hashing can surely impact the write speed of query. If hashing is complex, it will affect the performance. Lets try to use some complex hashing algorithm in the next section.

Latest Articles

How one space can create a nightmare for you…

As you know that MySQL 5.7 is going to be in its end of life this month (when I wrote this article) and many businesses are upgrading to 8 ( except few ones, believe me its true) . Many cloud vendors are providing extra support and time to their customer so that they can move…

tpc-c Benchmarking of MySQL 8.0.44

This setup is on my local machine for mac with 8.0.44. M2 chip, memory 16G High level Results : total transaction executed in 10 min – 247298Transaction per minute – 24729Time taken on average for every case – 0-26ms ( you have to do this calculation , testing wont tell you this. I have done…

Buffer pool insights

What I learned with time is the more I read about the Innodb engine and its code, the more I feel that I need to learn more.

Understanding the buffer pool in detail helps the DBA/Architect to understand how data is flowing from the disk to the buffer and their age in the buffer pool.

Understanding it at a very high level, flow works like Pages are read from data files i.e. ibd file, if they are not in cache or buffer, and then copied into the midpoint of the buffer pool. A buffer pool is a collection of pages ordered in the list structure. A midpoint is a place where the old and new sub-list meets i.e. the head of the old sublist.

imaginary diagram for the buffer pool which is maintained in the linked list data structure

This old sublist can be maintained from the innodb_old_blocks_pct and also for how long a data or block can stay in the old sublist ( don’t forget old sublist is part of a buffer pool that maintains the least recently used data). The duration for which data remain in the old sublist can be controlled from the old block time.

These pages can be from the user’s query or random or linear. Now if a particular page is coming from the user query it will move to the head of the new sub list and if the random read  is enabled(pages that are coming from the same extent) then will remain in the old sublist and can be evicted based on the eviction policy

The eviction policy of LRU old list is below :

Suppose out of a 10 GB buffer pool, we have given 3 GB to the old sublist(innodb_old_blocks_pct ). This means that the data which came as a result of random or linear or full table scanning will come first in the old sublist and reside there.  For example on performing a table scan, the data will come in the head of the old sublist first and if the same page is accessed again then after innodb_old_blocks_time it will move to the new sublist. It Is important to understand that the new sublist should not be filled with unwanted data otherwise the most accessed page will have to be evicted because of less memory and the LRU algorithm will become expensive

Few things to check about the old and new sub-list which can help us to decide if it needs further tuning. Take a look below which is a snapshot from the engine InnoDB status :

———————-

BUFFER POOL AND MEMORY

———————-

Total large memory allocated 137363456

Dictionary memory allocated 1077229

Buffer pool size   8191

Free buffers       1024

Database pages     7155

Old database pages 2621

Modified db pages  0

Pending reads      0

Pending writes: LRU 0, flush list 0, single page 0

Pages made young 1, not young 54162256.  <- – – – – – – – – – number of pages moved from old to new and number of pages in old sublist i.e. not being promoted to new list

0.00 youngs/s, 0.00 non-youngs/s.  <- – – – – – – – – – the number of access to make or to move a page from old to new and non-young means didn’t move to the new list. This shows whether pages are fequently getting move from old to new or is not moving at all . Depending on this value we can tweak innodb_old_block_pct or innodb_old_block_time

Pages read 129946, created 324, written 890

0.00 reads/s, 0.00 creates/s, 0.00 writes/s

No buffer pool page gets since the last printout

Pages read ahead 0.00/s, evicted without access 0.00/s, Random read ahead 0.00/s

LRU len: 7155, unzip_LRU len: 0

I/O sum[0]:cur[0], unzip sum[0]:cur[0]

In the next coming days, I am going to append more information on the insights of the buffer pool and which tables can help us to understand the status of all pages in the buffer pool.

Additionally, I will be appending more about the read-ahead process. Keep MySQLing.

Ankit
Linkedin

Other Articles

Some very basics of LSM tree….

This article is in continuation of my previous article on my journey from relational to distributed database. Also I talked about probabilistic data structure here. While discussing distributed databases with one of my colleague, I realised that we often miss focusing on basics and then I decided to publish this article in most simplest form.…

Who said nothing to do while migrating from MySQL 5.7 to 8 ?

As you know that MySQL 5.7 is going to be in its end of life this month (when I wrote this article) and many businesses are upgrading to 8 ( except few ones, believe me its true) . Many cloud vendors are providing extra support and time to their customer so that they can move…

Redo flushing. MySQL VS Postgres and Redo in 8/9

One of my earlier post MySQL Innodb – Internal Transaction flow and its related video talks about a transaction flow which gives the internal concept of transaction flow in Innodb. In this article I am going to talk about how the Redo log ( WAL in PG ) flushing is different in MySQL and Postgres and I will also present my thoughts as who is the winner here. Please note that I am not considering any specific version of MySQL or PG as concept will remain same.

Talking about MySQL ( and referring MySQL source code doxygen) , any transaction needs to go through the mtr ( mini transaction ) which means whatever changes happening on the data file should go through the mini transaction ( mtr ). Post transaction commit in mtr ( which means that user thread doesn’t touch log buffer or I think we can say it is not visible to the user) , data comes in the redo log buffer post making sufficient space in it or we can say post reserving the required number of LSN.

LSN can be reserved in below manner . However this is not our agenda of today’s topic.

 start_sn = log.sn.fetch_add(len)
         end_sn = start_sn + len

Here post reserving space in the log buffer, it needs to wait until user don’t get the corresponding (required) free space in log buffer and until then user thread should wait for this. In such cases if DBA observe slowness then he might consider to increase log_buffer size. From log buffer data goes to OS buffer and from OS buffer to disk (fsync or innodb_flush_method ) https://dev.mysql.com/doc/refman/8.0/en/innodb-parameters.html#sysvar_innodb_flush_method .

Post this user get notified about the write to disk and fsync. Also all the dirty pages ( modified pages ) has been added to flush list.

Until here I presume that this flow should be some how similar in PG as well but since I was not aware of PG, I wasnt confident on this.

During above flows several parameters like “innodb_flush_log_at_trx_commit” and ”innodb_flush_log_at_time_out” plays important role to control the flushing and check-pointing as well. Now in MySQL apart from this we don’t have much control to flush data to disk . One thing which I feel missing in redolog is ability to control group commit as we have for binary logs.

Whereas in PG , we do have extra flushing method which we call as “wal_sync_method” which do offers fdatasync() as well. In PG , I have realised that user has an ability to control group commit for redo log using variable commit_delay/commit_siblings ( you can read about this on PG documentation ). Additionally user has an ability to control if flushing is required or direct write to OS is required using variables like wal_writer_delay/wal_writer_flush_after . Obviously this can improve the performance of the database in scenarios where high Write throughput is required. MySQL provides this ability in background instead of giving this control to the user.

Although there are few variables which are new in MySQL 8.4 like innodb_log_spin_cpu_pct_hwm, , innodb_redo_log_capacity and few others. Even there are some status variables which are being recently introduced.

WHO WINS ?

From a user point of view , I must say PG is taking the lead position here as lot of control are in the hand of the user but on other hand it is must mentioning that whether these controls can really help in a high write throughput environment. In few days I will post my finding on this where I will use same storage type and same hardware configuration.

Reference :

https://dev.mysql.com/doc/dev/mysql-server/latest/PAGE_INNODB_REDO_LOG.html#sect_redo_log_general

https://www.postgresql.org/docs/12/runtime-config-wal.html

About Ankit Kapoor

Ankit Kapoor is a database geek and enjoy playing with open source databases like MySQL and PG.
Connect here on linkedin

SYS schema part 2

In last topic i tried to cover Sys schema introduction and how it is useful for a DBA in daily task :

Continuing this further :

As you know that sys schema helps DBA to get insight into what Mysql is doing with the help of its inbuilt views,stored procedure and functions.

Now to know which object is available , you can use information schema with help of below query :


select table_name, table_type from information_schema.tables where table_schema=‘sys’ union select routine_name, routine_type from information_schema.routines where routine_schema=‘sys’;

Now to check version of sys you are using;

select sys_version from sys.version;

Now , if i want to  check the file I/O by hostname and latency, I can use below view and it will display data in picoseconds which is really useful for optimising large scale application.

host_summary_by_file_io;

Now going more inside , if I want to see each stage of long running DML and its status, I can use views like processlist, session. To use this concerned instruments and consumers must be enabled, as i described in my earlier sessions related to the performance schema.

For example, if I would like to see current progress on alter table operation, I can use views like host_summary_by_stages for below mentioned stages :

  1. copying to tmp table
  2. alter table (end)
  3. alter table (sort)

We can also check lock latency, total rows examined, whether it is a full scan etc and then DBA can further optimise the query.

Please note , you cannot use mysqldump to take dump of sys schema rather you need to declare sys schema explicitly.

mysqldump -u -p —databases —routines sys > sys.sql
mysqlpump sys >sys.sql

Naming convention :
On doing show tables in sys schema, for every view there will be one more view prefixed with x$ which means that output is in human readable format.

Conclusion
In this topic, we have learnt how sys schema can be useful for us if we don’t want to make use of the performance schema.

Trending Articles

Mutex & MetaData lock handling with Performance and Sys Schema in MySQL

Thought of writing this blog came in my mind when I was struggling with high CPU and waiting of queries in my live production environment of MySQL DB . One case which I can recall easily is of a night when physical backup of my database started using MEB/PEB (MySQL enterprise backup and Percona xtrabackup) which takes the exclusive lock in the initial phase and last phase of backup for a defined amount of time. During this time all the queries goes in a waiting state and when I checked in the show process-list, it says “waiting for meta data lock”. One more case which i can recall is the contention among various threads while writing in to the binary cache and binary log. Such locks are called as mutex lock and can be catch from the various tables of performance schema in MySQL. Imagine a real situation when your live database is running with high number of connections and your load is CPU bound and you met with such a situation where your queries are being slowed down due to the locks already being acquired by other transactions and you want to make sure that the business should not be impacted anyhow, understanding these types of locks will help you to eliminate the weird situation you can be in.

In a highly concurrent environment where threads are competing with each other to gain resource access, locking needs to be properly implemented on all the databases in an instance and objects including table, data, cache, buffers, files etc. In MySQL locks can be at table level as well as at row level locks (multi-granular locking) and at the memory level. These locks needs to be implemented in order to maintain data consistency and to reduce the contentions. Now some locks can be user managed (like shared and exclusive locks) and some are system managed. In system managed we have mutual exclusion or say mutex .

Mutex also works as a exclusive lock so that one thread can access a particular memory resource or a file (for example binary logs) at a time so that other threads which are requesting for same resource doesn’t interrupt its task and once thread complete its task it will release the lock and other thread/s which is/are waiting in queue will take over. Hence main thread will acquire mutex first and then it performs the required task and release the lock. One of the example of mutex is binary log. In case of syn_binlog > 1 , there is always one leader thread which is responsible for flushing the bin log cache to disk after the n number of group commit and other threads are follower. Leader thread will take the mutex lock and release it once data get flushed on the disk.

mysql_mutex_lock(&LOCK_log);

    DEBUG_SYNC(leader->thd, "commit_after_get_LOCK_log");
    mysql_mutex_lock(&LOCK_group_commit_queue);
    current= group_commit_queue;
    group_commit_queue= NULL;
    mysql_mutex_unlock(&LOCK_group_commit_queue);

//// I have taken this snippet of mutex from Percona mysql code from git hub.

show engine innodb mutex;

I have copied this line from mysql document page i.e.

“SHOW ENGINE INNODB MUTEX displays InnoDB mutex and rw-lock statistics”

Sample output showing all rwlock . For mutex lock only mutex will be shown.

Apart from this, mutex status can be monitored from the Performance schema as well. In later section you will see which INSTRUMENT is responsible for enabling mutex and which table is responsible for mutex monitoring.

for (ulint i = 0; i < n_sync_obj; i++) {
        rw_lock_create(hash_table_locks_key, table->sync_obj.rw_locks + i,
                       level);
      }
////  This is a snippet of hash0hash.cc where rwlock is created. 

/// In mysql doc it has been mentioned that for mutex it will report only Mutex name but for rwlock it will mention file name as well as line number. I believe they should mention same for mutex as well as it will really help alot.

For mutex we have 223 instruments for different purpose and corresponding table to check for mutex lock is performance_schema.mutex_instances.

Related instruments for mutex can be found from setup_instrument table with wait/synch/mutex/ and can be enabled dynamically. I am trying to re-produce the mutex locking scenario which I will add once I have some data. For now it can be understand that table “events_waits_current” in performance can help in analysing the mutex lock.

Meta-Data locks

What is metadata lock ?

Metadata locks helps us in acquiring a lock on table structure so that if a thread is in some transaction (i.e. begin and end transaction) and if there is another thread waiting for same resource to alter the structure of the table then the requesting thread will come into the meta data lock mode. Such scenarios can really hamper the database performance in a production environment. Think of a scenario where your application has started a transaction :

Session 1
Session 2
SESSION 3 ( from show processlist;)

With the help of show processlist it is visible that the requesting thread is waiting for the meta data lock to be released from the other thread. But problem is it is not easy to locate which thread is holding the lock ,not even SHOW ENGINE INNODB STATUS really help. But Performance schema and sys schema will be helpful here . Let us see how :

PSI_stage_info MDL_key::m_namespace_to_wait_state_name[NAMESPACE_END] = {
    {0, "Waiting for global read lock", 0, PSI_DOCUMENT_ME},
    {0, "Waiting for backup lock", 0, PSI_DOCUMENT_ME},
    {0, "Waiting for tablespace metadata lock", 0, PSI_DOCUMENT_ME},
    {0, "Waiting for schema metadata lock", 0, PSI_DOCUMENT_ME},
    {0, "Waiting for table metadata lock", 0, PSI_DOCUMENT_ME},
    {0, "Waiting for stored function metadata lock", 0, PSI_DOCUMENT_ME},
    {0, "Waiting for stored procedure metadata lock", 0, PSI_DOCUMENT_ME},
    {0, "Waiting for trigger metadata lock", 0, PSI_DOCUMENT_ME},
    {0, "Waiting for event metadata lock", 0, PSI_DOCUMENT_ME},
    {0, "Waiting for commit lock", 0, PSI_DOCUMENT_ME},
    {0, "User lock", 0, PSI_DOCUMENT_ME}, /* Be compatible with old status. */
    {0, "Waiting for locking service lock", 0, PSI_DOCUMENT_ME},
    {0, "Waiting for spatial reference system lock", 0, PSI_DOCUMENT_ME},
    {0, "Waiting for acl cache lock", 0, PSI_DOCUMENT_ME},
    {0, "Waiting for column statistics lock", 0, PSI_DOCUMENT_ME},
    {0, "Waiting for resource groups metadata lock", 0, PSI_DOCUMENT_ME},
    {0, "Waiting for foreign key metadata lock", 0, PSI_DOCUMENT_ME},
    {0, "Waiting for check constraint metadata lock", 0, PSI_DOCUMENT_ME}};


//// These are the metadata lock threads states which can be find in mdl.cc

Corresponding instrument for meta data locks for waiting queries which is enabled by default under setup_instrument table is:

wait/lock/metadata/sql/mdl

There are other instrument as well for metadata lock and corresponding table for metadata lock is performance_schema.metadata_locks

We can find the thread which has acquired the metadata lock for above transaction:

SELECT * FROM metadata_locks;
will only show the real or current rows and will be purged out when resolved.

column lock_status tells whether lock has been granted or in pending state. OWNER_THREAD_ID 97 is in PENDING STATE and the corresponding lock is with OWNER_THREAD_ID 80 which is holding SHARED_READ lock on database ankit and table t1_metadata. Taking the advantage of thread table in performance_schema can further be helpful to deep dive by selecting the rows with thread 80 and 97.

if you see here : thread_id 97 with process_id 33 (connection id from processlist ) is waiting for meta data lock from thread id 80

Hence 80 is the thread which is holding the lock since 474 seconds and corresponding thread is waiting for 456 seconds. Even to have more deep dive it is beneficial to use sys.session

output from sys.session

Combining all the above information in sys.schema_table_lock_waits can finally provide the solution to overcome this locking :

schema_table_lock_waits can tell us what action to be taken in order to resolve above meta data issue by referring the column sql_kill_blocking_query.


Some basic concepts and variables of MySQL should be known while handling this in real environment:

1. lock_wait_timeout
2. Type of isolation
3. query_time

Understanding how lock works in mysql is a key concept behind database performance.

Read latest articles

Bloom Filters

This article explain about the bloom filters in LSM tree databases.

Components in MySQL 8

This article is purely based on my understanding of Components and the outcome of my dirty hands. Reference of this Article is “MySQL official documents” & my experience with components.

Oracle introduced Components in MySQL 8.0 and user can locate its table under mysql database. See below figure.

1EDDDCE9-B386-4EEE-954D-2742904FDCBF

What is a component and why we need it ??

Components are similar to the Plugins but are more secure and provides improved & additional features. Moreover plugins will be deprecated in future versions.

If we want “audit logs” to be enable or have strong password mechanism, a user need to install respective plugins. But there are few challenges :

1. Plugins can interact only with server but not with each other which limits its usage.
2. Plugins interact directly with server components which means they are not encapsulated .
3. While installing plugins a user needs to mention the extension file name as well. For example .so or .dll

These are some of the over head or disadvantage of plugins which a DBA normally face. I remember once I required to install an “audit” plugin and being on linux platform , it requires a “.so” file . So in this case I made ensure that I should have  “.so” extension plugin .

But components remove above mentioned challenges. Components are more secure as it is encapsulated and provides defined set of services. Major advantages are :

1. Components can interact each other.
2. With components DBA doesn’t need to worry about remembering the extension file name. For example while installing “validate password” component user can simply install it as shown in below picture post which a user can check whether component has been successfully installed . Additionally we can uninstall if not required.

FAA1B240-1FA1-4C90-B8C4-DAA49EB1736E

3. A user can create his own plugins using existing macros . Some of the header for this component are as follows :

#include “validate_password_imp.h

#include <assert.h>

#include <string.h>

#include <algorithm>

#include <atomic>

#include <fstream>

#include <iomanip>

#include <set>

#include <sstream>

#include “mysql/components/library_mysys/my_memory.h

#include “mysql/components/services/mysql_rwlock.h

#include “mysql/components/services/psi_memory.h

#include “mysqld_error.h”

Respective macros can be found from MySQL distribution code

3.a After this, copy any macros of existing components and get the basic framework ready.
3.b Copy any of the service ( header file) and compile it using the source distribution of the MySQL server.

Currently below plugins are available to use. At the current moment not all components are available and thus plugins can be used in place but in future, plugins will be completely removed.

  1. Error logging
  2. Audit Messaging and logs
  3. MySQL Enterprise Data Masking and De-Identification Password Validation
  4. MySQL Enterprise Firewall
  5. Plugin API
  6. Thread Pool
  7. Version Tokens

Once enable, user can see the respective variables using “show global variables” .

Such variables starts with prefix “component name”. For  example in “validate_password”  , below are the variables which will be visible once user enable this component :

components

What about  “Audit log” component & how it is useful ??.

There are various cases when application need to append some specific string in audit logs. In such case we can use an UDF which is known as “audit_api_message_emit_udf()”.

  1. First install “audit log” component in similar manner which we used to install validate password component:

component

2. Now we wanna check if we can add some message to the audit log:

UDF_audit

If the required arguments has been passed, we will receive OK message which means that it is a success..This link provide argument required for this UDF

Hence stating this we have other components too, we can make our own also and in future it will replace the plugins. Moreover if are using plugins these days and planning to work on MySQL 8 , then you have to remove plugins as it will be going to remove in future.

Sys Schema MySQL 5.7+


2nd post is here

While working on Performance schema for my customers, I have realised the importance of sys schema which is rarely being used. In this blog, I will cover 2 articles on “SYS” schema. SYS schema is  used to monitor your database performance and facilitates easier way to use instruments and consumer.

You can find sys schema in MySQL 5.7 by querying :

show databases;

“SYS” schema is introduced in 5.7+ versions default . In previous versions : we need to download from GITHUB:

https://github.com/mysql/mysql-sys

Previously, this sys schema was known by ps_helper which was deigned by Mark Leith.

SYS schema is a collection of various objects i.e. Procedures, functions, Triggers,Views etc which help us to gather information required for troubleshooting issues like slow queries or inspection of any instrument and can be diagnosed based on the gathered information.

So, when i say view, I mean that in “sys” schema we have varieties of views which are derived from Performance schema’s tables. For example : host_summary_by_file_io

When i say procedures , i mean sys schemas has various procedure which allow us to perform various task . Take example of “create_synonym_db(‘db_name’, ‘synonym_name’)“.  This procedure creates a duplicate database with all the objects present in it.

When i say function , i mean sys schemas contains various functions to achieve a specific task. Take an example of “extract_schema_from_file_name

So  if i want to know schema name of a particular data file , i can use this function . For example:

SELECT extract_schema_from_file_name(‘/data/data_dir/test_db/t1.ibd’);

this will provide result “test_db“.

Now , to use sys schema , one should remember :

  1. Performance Schema must be enabled.
  2. Wait,Stage,Statement instrument must be enabled. If you want to know how to enable this , read my previous blogs on MySQL instrument.

Alternatively , we can use inbuilt function of sys schema ( ps_setup_enable_instrument) to enable it.

Conclusion
Rare topics have covered the sys schema and its insights. This blogs gives an introduction to the sys schema.

Other Articles :

Redo flushing. MySQL VS Postgres and Redo in 8/9

One of my earlier post MySQL Innodb – Internal Transaction flow and its related video talks about a transaction flow which gives the internal concept of transaction flow in Innodb. In this article I am going to talk about how the Redo log ( WAL in PG ) flushing is different in MySQL and Postgres and…

MySQL Instrument 2

In Introduction to Instruments I have covered what instruments are (which is a part of performance schema), how they look like and where can you find it in i.e. setup_instruments table of performance_schema. I have also covered how a DBA can make use of it . There are 1016 set of instrument in MySQL 5.7.17 which is more than what we have in 5.6. A DBA can enable/disable them as per your needs.

In structure of this table there are 3 columns i.e. Name,Enabled,Timed

mysql> show create table setup_instruments;
+-------------------+--------------------------------------------------------
| Table | Create Table |
+-------------------+--------------------------------------------------------
| setup_instruments | CREATE TABLE `setup_instruments` (
`NAME` varchar(128) NOT NULL,
`ENABLED` enum('YES','NO') NOT NULL,
`TIMED` enum('YES','NO') NOT NULL
) ENGINE=PERFORMANCE_SCHEMA DEFAULT CHARSET=utf8 |
+-------------------+--------------------------------------------------------
1 row in set (0.00 sec)

So we have multiple instruments, like I pasted below for alter_db, drop_function, repair etc. For these instrument we can check why it is taking time and where the query is spending most of the time.

statement/sql/alter_db
statement/sql/repair 
statement/sql/replace 
statement/sql/replace_select
statement/sql/create_udf
statement/sql/drop_function
statement/sql/revoke
statement/sql/optimize

Hence we can check which instruments are enabled as shown below:

mysql> select * from setup_instruments where ENABLED ='YES';
+----------------------------------------------------------------------------
| NAME | ENABLED | TIMED |
+--------------------------------------------------------------------------------+---------+-------+
| wait/io/file/sql/map | YES | YES |
| wait/io/file/sql/binlog | YES | YES |
| wait/io/file/sql/binlog_cache | YES | YES |
327 rows in set (0.00 sec)

To enable all these instrument , please ensure that performance_schema must be ON :

mysql> show global variables like '%performance_schema%';
+----------------------------------------------------------+-------+
| Variable_name | Value |
+----------------------------------------------------------+-------+
| performance_schema | ON |
+----------------------------------------------------------+-------+

Now , there is one more table known as setup_consumers, which provides the information stored about “”instrument”” . What i mean by this is “What kind of data will be stored in the related ( BY RELATED I MEAN , WHAT KIND OF DATA WILL BE LOGGED TO MONITOR THE PERFORMANCE IN TABLE)”.

In below table, only event_statement_current and event_statement_history is turned ON which means all information related to DDL/DML statement will be logged.

mysql> select * from setup_consumers;
+----------------------------------+---------+
| NAME | ENABLED |
+----------------------------------+---------+
| events_stages_current | NO |
| events_stages_history | NO |
| events_stages_history_long | NO |
| events_statements_current | YES |
| events_statements_history | YES |
| events_statements_history_long | NO |
| events_transactions_current | NO |
| events_transactions_history | NO |
| events_transactions_history_long | NO |
| events_waits_current | NO |
| events_waits_history | NO |
| events_waits_history_long | NO |
| global_instrumentation | YES |
| thread_instrumentation | YES |
| statements_digest | YES |  < -------------- This is useful , we will cover it in this chapter.
+----------------------------------+---------+

So in above output, we can see that event_statement_current and event_statement_history is turned ON, which means current and historical data will be saved. So very soon we will see what these tables will show us. Please note that for every monitor, performance_schema has respective tables.

Please note that all these “instrument” are event name in events table.
Lets select some records from one of the event table events_statements_current and try to understand what information it provides:

mysql> select * from events_statements_current limit 1\G;
*************************** 1. row ***************************
THREAD_ID: 807336 <- This is Thread ID
EVENT_ID: 23739
END_EVENT_ID: 23739
EVENT_NAME: statement/sql/set_option ##### "This is instrument name" .
SOURCE: socket_connection.cc:95 ###### This is source code (https://github.com/bjoernv/mysql-packaging)
TIMER_START: 591734569357461000 ###### Start Time in PICO SECOND.
TIMER_END: 591734569450550000 ####### End time in pico second
TIMER_WAIT: 93089000 ###### Waiting time in pico second
LOCK_TIME: 0 ######## lock time in pico second
SQL_TEXT: SET autocommit=1  ###### Query
DIGEST: 54b0116d21e24f638f94bd799148b397
DIGEST_TEXT: SET `autocommit` = ?  ###### Shows same output for other values in SQL
CURRENT_SCHEMA: cim_user2
OBJECT_TYPE: NULL
OBJECT_SCHEMA: NULL
OBJECT_NAME: NULL
OBJECT_INSTANCE_BEGIN: NULL
MYSQL_ERRNO: 0
RETURNED_SQLSTATE: 00000
MESSAGE_TEXT: NULL
ERRORS: 0
WARNINGS: 0
ROWS_AFFECTED: 0
ROWS_SENT: 0
ROWS_EXAMINED: 0
CREATED_TMP_DISK_TABLES: 0
CREATED_TMP_TABLES: 0
SELECT_FULL_JOIN: 0
SELECT_FULL_RANGE_JOIN: 0
SELECT_RANGE: 0
SELECT_RANGE_CHECK: 0
SELECT_SCAN: 0
SORT_MERGE_PASSES: 0
SORT_RANGE: 0
SORT_ROWS: 0
SORT_SCAN: 0
NO_INDEX_USED: 0
NO_GOOD_INDEX_USED: 0
NESTING_EVENT_ID: NULL
NESTING_EVENT_TYPE: NULL
NESTING_EVENT_LEVEL: 0
1 row in set (0.00 sec)

Taking an another example of its usage, in case we want to see all those current queries which has lock_time > 0 below query will give us the data and then we can optimise the query mentioned in SQL_TEXT.

select * from events_statements_current where lock_time > 0;

Let’s evaluate statements_digest . This is very useful tool in identifying slow queries if queries are not using index, how much time this query ran etc.

*************************** 1. row ***************************
SCHEMA_NAME: ABC
DIGEST: 83b9e1dc432459828ed9a4d65aef7efe
DIGEST_TEXT: SELECT `A` , COUNT (?) FROM `ABC` . `C` WHERE `ID` IN (...) GROUP BY `ID`
COUNT_STAR: 4283945 <-------- This query ran this number of time.
SUM_TIMER_WAIT: 12795126000
MIN_TIMER_WAIT: 12795126000
AVG_TIMER_WAIT: 12795126000
MAX_TIMER_WAIT: 12795126000
SUM_LOCK_TIME: 1068000000 <----- Total lock time
SUM_ERRORS: 0 <- No errors
SUM_WARNINGS: 0
SUM_ROWS_AFFECTED: 0
SUM_ROWS_SENT: 4
SUM_ROWS_EXAMINED: 357 <-- number of examined rows
SUM_CREATED_TMP_DISK_TABLES: 0   <--- if any temporary tables
SUM_CREATED_TMP_TABLES: 1
SUM_SELECT_FULL_JOIN: 0 <---- Full joins
SUM_SELECT_FULL_RANGE_JOIN: 0 <--- Full range join
SUM_SELECT_RANGE: 1
SUM_SELECT_RANGE_CHECK: 0
SUM_SELECT_SCAN: 0
SUM_SORT_MERGE_PASSES: 0
SUM_SORT_RANGE: 0
SUM_SORT_ROWS: 4
SUM_SORT_SCAN: 1
SUM_NO_INDEX_USED: 0 <- No index used
SUM_NO_GOOD_INDEX_USED: 0
FIRST_SEEN: 2018-05-25 16:35:38 <- Query ran first time
LAST_SEEN: 2018-05-25 16:35:38 <- Query ran last time

This is equivalent to pt_query_digest tool from Percona tool kit.

So now it is easy to keep track of various queries before putting it in production and we can monitor as well and in this way you can enable / disable instrument using below command :

update setup_instruments set enabled='NO' where name like '%IO%';

Taking one more example, now i want to check most frequent events waiting. For this we have table :

mysql> select * from events_waits_summary_global_by_event_name where count_star >0 order by count_star desc limit 1\G;
*************************** 1. row ***************************
EVENT_NAME: wait/io/table/sql/handler
COUNT_STAR: 42057624429
SUM_TIMER_WAIT: 77766263675607248
MIN_TIMER_WAIT: 51448
AVG_TIMER_WAIT: 1848640
MAX_TIMER_WAIT: 227940787813800

Taking another example of most frequent time a FILE has waited. Below query shows, most frequent file event in READ. So in this example innodb_data_file read most:

mysql> select * from file_summary_by_event_name where count_read > 0 order by count_read desc limit 1\G;
*************************** 1. row ***************************
EVENT_NAME: wait/io/file/innodb/innodb_data_file
COUNT_STAR: 15766760
SUM_TIMER_WAIT: 10702863789499124
MIN_TIMER_WAIT: 0
AVG_TIMER_WAIT: 678824532
MAX_TIMER_WAIT: 509288622556
COUNT_READ: 9928666
SUM_TIMER_READ: 8695743706041360
MIN_TIMER_READ: 4804284
AVG_TIMER_READ: 875821540
MAX_TIMER_READ: 509288622556
SUM_NUMBER_OF_BYTES_READ: 162674245632
COUNT_WRITE: 4379186
SUM_TIMER_WRITE: 169500476525368
MIN_TIMER_WRITE: 4417552
AVG_TIMER_WRITE: 38705900
MAX_TIMER_WRITE: 33147286296
SUM_NUMBER_OF_BYTES_WRITE: 73817784320
COUNT_MISC: 1458908
SUM_TIMER_MISC: 1837619606932396
MIN_TIMER_MISC: 0
AVG_TIMER_MISC: 1259585252
MAX_TIMER_MISC: 37993360460
1 row in set (0.01 sec)

Similarly to identify the files which were being written most, can be done using below :

mysql> select * from file_summary_by_event_name where count_write > 0 order by count_write desc limit 1\G;
*************************** 1. row ***************************
EVENT_NAME: wait/io/file/sql/binlog
COUNT_STAR: 7611571
SUM_TIMER_WAIT: 1142126255583392
MIN_TIMER_WAIT: 0
AVG_TIMER_WAIT: 150051144
MAX_TIMER_WAIT: 56774758932
COUNT_READ: 918412
SUM_TIMER_READ: 8858813984764
MIN_TIMER_READ: 0
AVG_TIMER_READ: 9645628
MAX_TIMER_READ: 20452624404
SUM_NUMBER_OF_BYTES_READ: 6591392330
COUNT_WRITE: 4658695
SUM_TIMER_WRITE: 102365348448260
MIN_TIMER_WRITE: 3264768
AVG_TIMER_WRITE: 21972656
MAX_TIMER_WRITE: 24619224396
SUM_NUMBER_OF_BYTES_WRITE: 3369255287
COUNT_MISC: 2034464
SUM_TIMER_MISC: 1030902093150368
MIN_TIMER_MISC: 0
AVG_TIMER_MISC: 506719200
MAX_TIMER_MISC: 56774758932

This will help a DBA to identify the files get write most or read most or events or queries that needs optimisation.

About Ankit Kapoor

Ankit Kapoor is a database geek and enjoy playing with open source databases like MySQL and PG and Myrocks.
Connect with me on linkedin


Instruments in MySQL

Update – “setup_timers” table has been depreciated and is removed in MySQL 8.0. This blog is covering the details for 5.7/8.0/9.4. There might be some changes that reader can expect in 8.0 and 9.4

Blog starts from this point –

This is a two article series on Instrument in MySQL. This is the first one and second one can be read from here

Instrument are the main part of performance schema . Well, it is useful in cases when i want to dive inside a problem . For an example, if i want to check what IO operation is causing my DB slow down or what file a process is waiting for or what stage is taking time, which connection is expensive etc.

But this is also true that enabling them , affects mysql performance. Hence you need to follow strategy as per your needs.You can enable all of them while in testing environment and can tune your queries or can enable few of them in production environment to monitor your DB performance.

Instruments are combination of different set of components like wait/io/file/sql/binlog.Instrument start from general and get more deeper. We can identify how specific are they by the length of the name of instruments.

I can check all instrument from performance_schema.setup_instruments table whether they are enabled or not. There are thousand of instrument which are responsible for representing different activities.


—-Update—

There are more than 600 such instruments for different purposes in MySQL 5.7

like for sql binlog, innodb_data_file,replication,page lock, mutex lock,select,delete,show privileges , load,copying to tmp table.

So every instrument is not enabled, but we can enable it and can check which is enabled by executing below query :

select * from setup_instrument where enabled='Yes'

We have one more table which is setup_consumer which tells you how much data you would like to save . By this i meant , history or current data.


If we check in setup_timers table , we find different component there which are prefix in all instrument , like below :

1. Idle ( microcycle)

2. Stage (cycle)

3. Statement (nano)

4. Wait (nano)

Idle will give internal information on socket connection and information related to a thread like how much packet has been transferred .

Stage tell the execution stage of any query like reading data, sending data, altering table, checking query cache for queries etc.  Instrument for this can be represented as stage/sql/altering table.

Statements are related to sql,abstract,com which i will give more information later.Instrument for this can be statement/sql/select.

Wait , as the name implies all the wait operation comes here. Like mutex waiting  , file waiting, I/O waiting ,table waiting.Instrument for this can be wait/io/file/sql/map.

Instrument should alway be read from left to right.

In the next session , i will cover how it helps in improving your database performance. Please be aligned.

Your comments are welcome.

About Ankit Kapoor

Ankit Kapoor is a database geek and enjoy playing with open source databases like MySQL and PG.
Connect with me on linkedin

changing innodb table’s(existing table)path when innodb file per table is enabled & to reduce downtime in production.

In one of the real production scenario, I have faced a situation where the disk of underlying data directory was used upto 90 % and this disk size cannot be increased. Hence the only option left was to add the new disk but in mysql (before 8) we really don’t have any option to create multiple data directories and can only be one at that moment. Challenges of this approach has been mentioned in the last of this article.

Data file of an innodb table in background has been represented by .ibd file when innodb file per table is enabled. If it is not enabled then either data of this table will reside in system tablespace i.e. ibdata01 or in user defined table space which can be created by ‘create tablespace’.

In this paper, I am considering that innodb file per table is enabled. In Mysql, we define data directory in cnf file which remains default for every table until we don’t specify data directory parameter while creating the table which is like below :

create table table_name(table def) data directory =‘new one’;

When this table get created I see a .isl file of this newly created table (say test.isl ) in the default data directory which contains path of ibd file (say test.ibd ) of this newly created table. So this is typically like a symbolic link of linux.

So, this is done and we can put our new table to another location apart from default one. But problem started when I wanted to move my ***existing table*** to the new location.

Simple option is to re create this table with new data directory and take dump and restore which is a time taking approach.

Now to solve this, I made use of this “isl” file which can be easily understand by mysql. On creation of normal innodb table we have ibd and frm file only.

I have a table test and data file as test.ibd, and test.frm as definition which resides in /default_data/data mount point. As per requirement, i want to move this table in new mount point i.e. /new_data/data .

So, firstly i make a isl file like this :

echo ‘/new_data/data/test.ibd’ > /default_data/data/test.isl

(you can also create this isl file in some other data directory at this step & later copy it into data dir)

and then create a folder /new_data/data

Now, I have to shutdown my database cleanly and for that disable innodb fast shutdown variable. At this time it is also best to take the buffer pool dump with the help of innodb_buffer_pool_dump_at_shutdown and innodb_buffer_pool_load_at_startup and yes pct value should be defined as per the requirement of the page required post start up.

Once it is down move the test.ibd file to the new location

mv test.ibd /new_data/data/

if you have put isl file in different location then move isl file to default data directory :

mv test.isl /default_data/data/

make ensure that owner of isl file is mysql and if it is not then mysql cannot recognize this table and will throw error that table space of this table is missing.

Now restart the mysql and check if table is accessible. If in case your table is not accessible , then it is purely permission and ownership related issue.

This method is the best possible to reduce downtime when you are in production.

Challenges with this approach

During the time of alter table, this might create some issues because the location of the ibd file in frm and ibdata is registered as the default data directory. Hence this should be taken into account while implementing this approach.

About Ankit Kapoor

Ankit Kapoor is a database geek and enjoy playing with open source databases like MySQL and PG.
Connect with me on linkedin